
Page 52 - Mantena Annual report 2019
P. 52
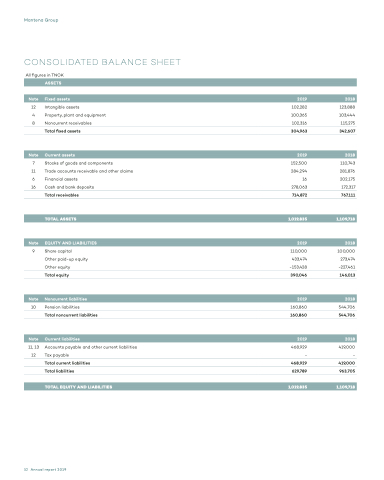
Mantena Group
CONSOLIDATED BALANCE SHEET
All figures in TNOK
 ASSETS
Note
Fixed assets
2019
2018
12 4 8
7 11 6 16
9
10
11, 13 12
Intangible assets
Property, plant and equipment Noncurrent receivables
Total fixed assets
Stocks of goods and components
Trade accounts receivable and other claims Financial assets
Cash and bank deposits
Total receivables
Share capital
Other paid-up equity Other equity
Total equity
Pension liabilities
Total noncurrent liabilities
Accounts payable and other current liabilities Tax payable
Total current liabilities
Total liabilities
102,282 100,365 102,316
304,963
152,500 284,294 16 278,063
714,872
110,000 433,474 -153,428
390,046
160,860
160,860
468,929 -
468,929
629,789
123,888 103,444 115,275
342,607
110,743 281,876 202,175
172,317
767,111
100,000 273,474 -227,461
146,013
544,706
544,706
419,000 -
419,000
963,705
      Note
Current assets
2019
2018
      TOTAL ASSETS
1,019,835
1,109,718
Note
EQUITY AND LIABILITIES
2019
2018
      Note
Noncurrent liabilities
2019
2018
      Note
Current liabilities
2019
2018
         TOTAL EQUITY AND LIABILITIES
1,019,835
1,109,718
52
Annual report 2019
